Sixteen culture capitals
Sixteen cities that
programme the world.
Every city keeps its own hours. Vienna starts at seven in a coat and tie, Berlin at midnight in whatever you slept in, Tokyo sells out in ninety seconds. Sixteen portraits with the houses that matter.
The map
Where the programme is
Tap a city for its culture index, the number of venues in the guide and the way in.
 86
86Germany
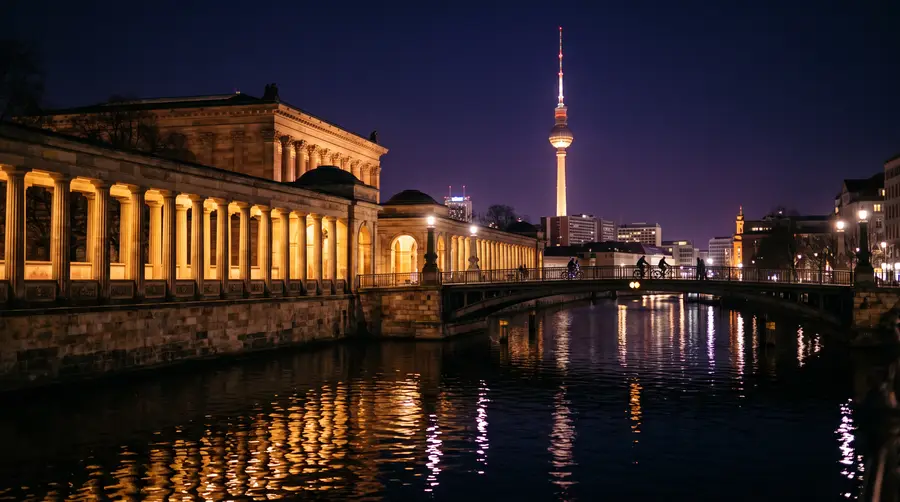
Berlin
Three opera houses, five museums on one island and a club that never asks the time
 85
85United Kingdom
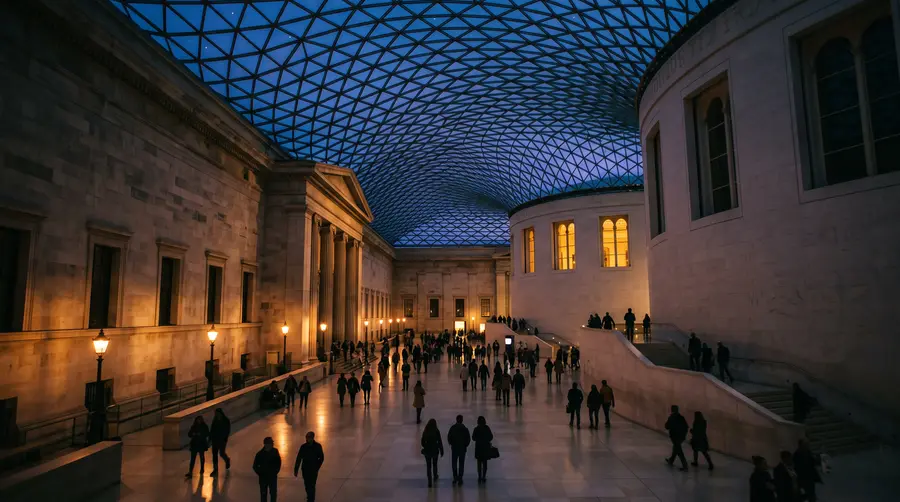
London
The greatest free collections on earth and the most expensive tickets in Europe
 85
85United States
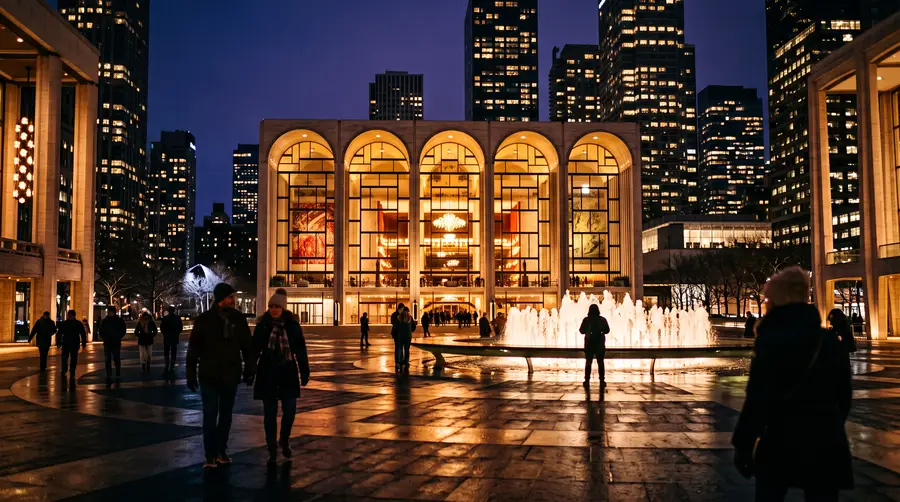
New York
Broadway, the Met and a downtown that reinvents the rules every decade
 85
85Japan
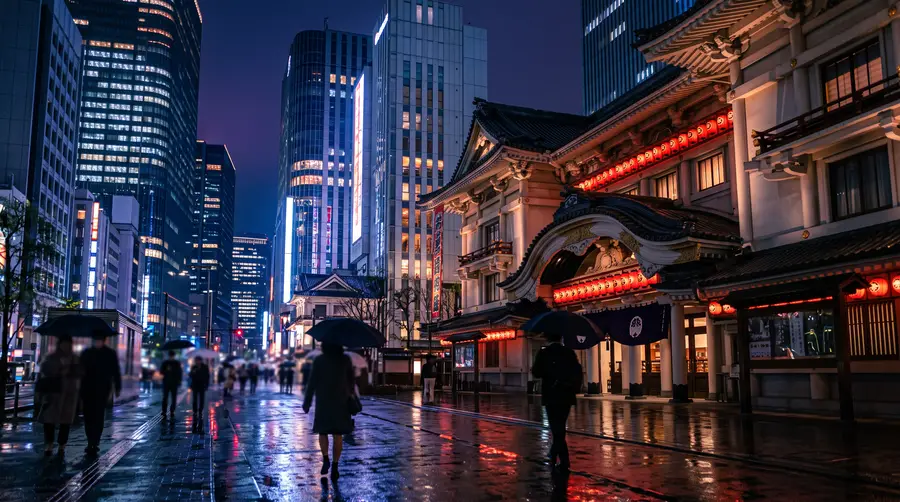
Tokyo
Kabuki in the afternoon, teamLab after dark and jazz rooms the size of a lift
 85
85South Korea
Seoul
Palace courtyards, a state museum the size of an airport and an art fair that moved the market east
 84
84Austria
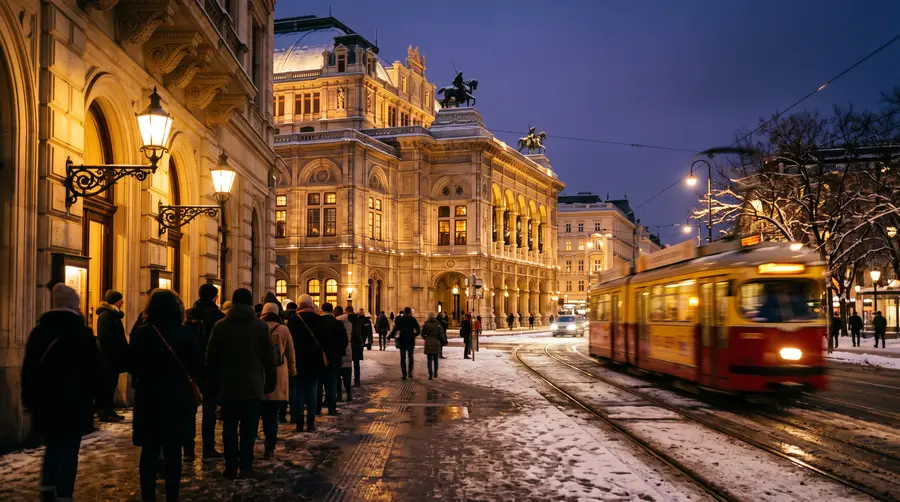
Vienna
Standing room at the State Opera for the price of a coffee
 83
83Spain
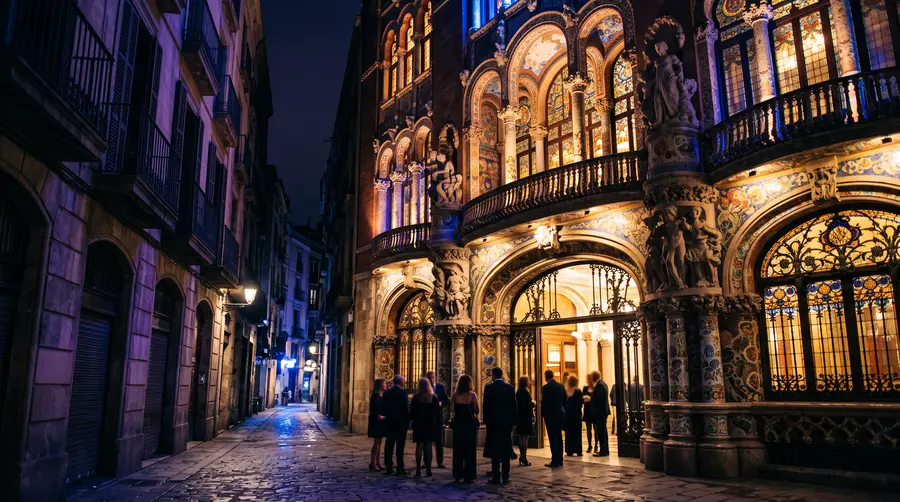
Barcelona
Modernisme as a city plan, Miró on a hill and electronic music as an export
 83
83Mexico
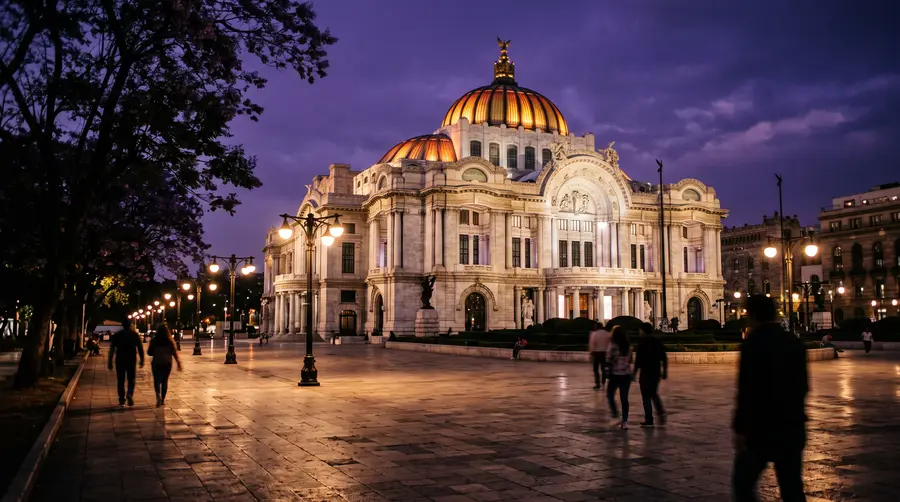
Mexico City
The best anthropology museum on earth, murals on government walls and galleries in Art Deco houses
 82
82France
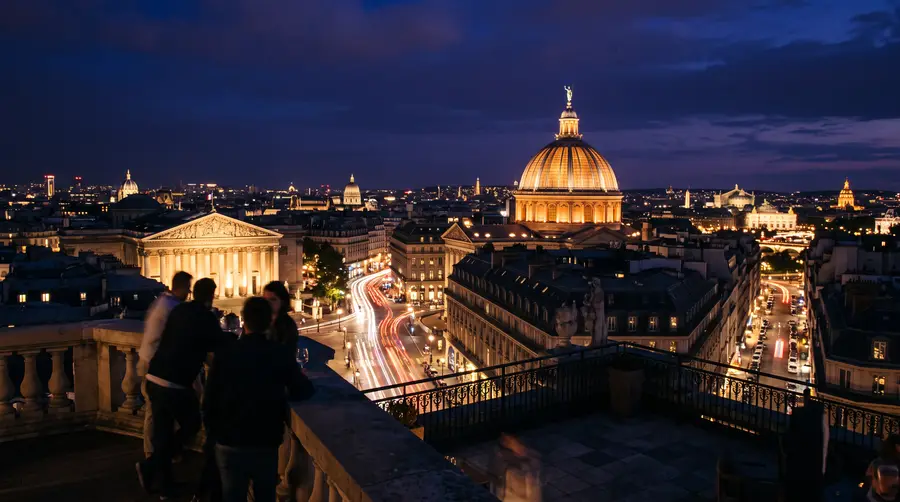
Paris
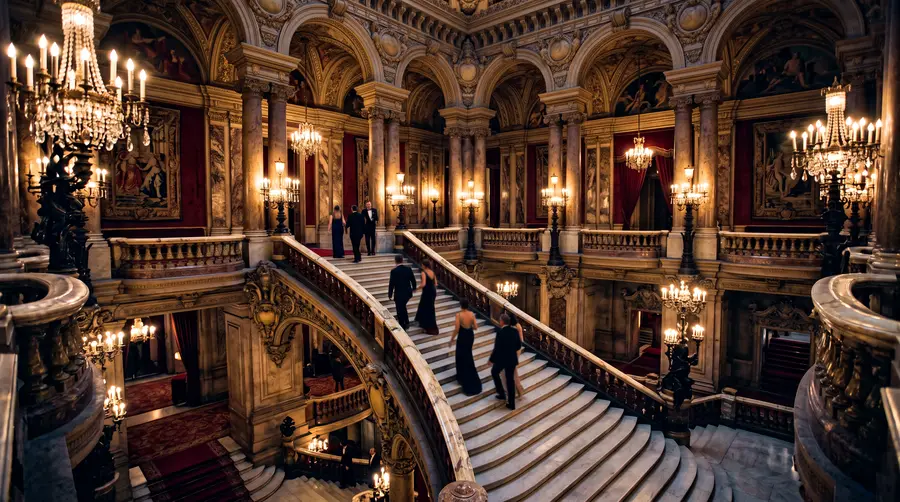
The museum as a state religion, and an opera house built to be looked at
 82
82Italy
Milan
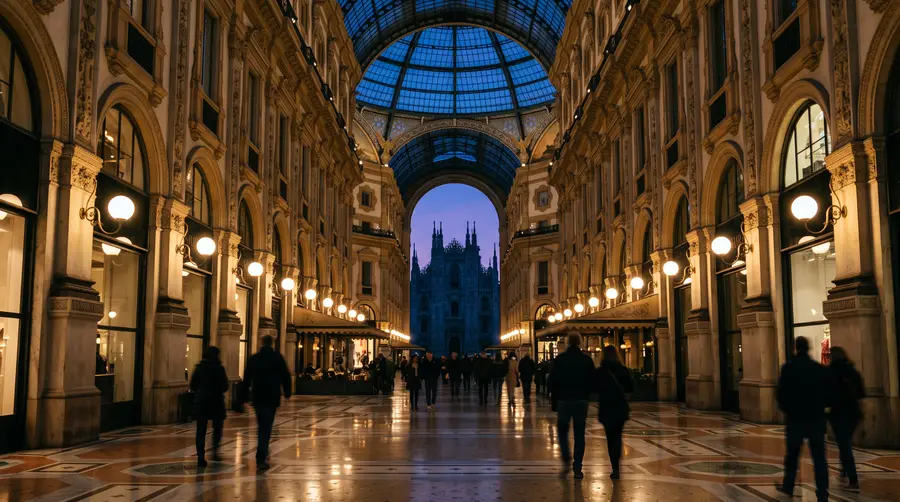
La Scala, a Last Supper you need to book months ahead and design week
 81
81Netherlands
Amsterdam
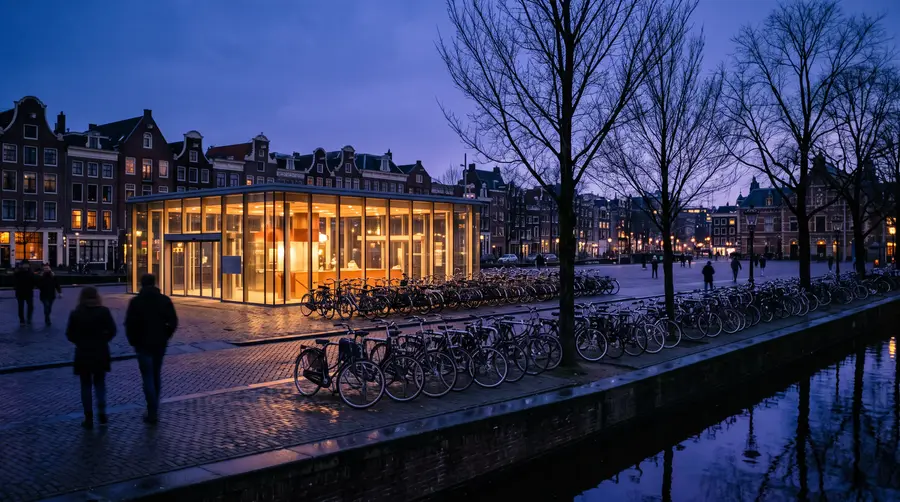
Rembrandt and Van Gogh in one square, and a club culture with its own night mayor
 80
80Portugal
Lisbon
A private collection worth a detour, a power station full of art and fado in a back room
 80
80United Kingdom
Edinburgh
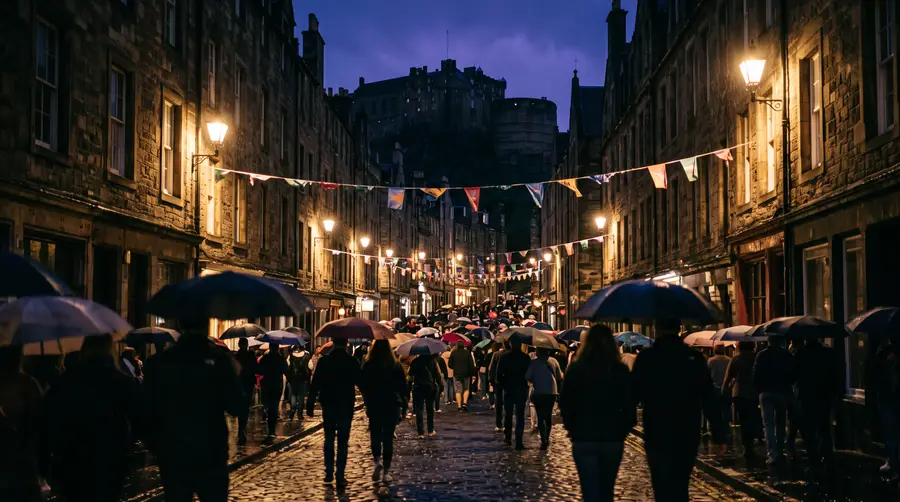
For one month a year the largest arts festival on earth, and free national galleries all the others
 79
79United States
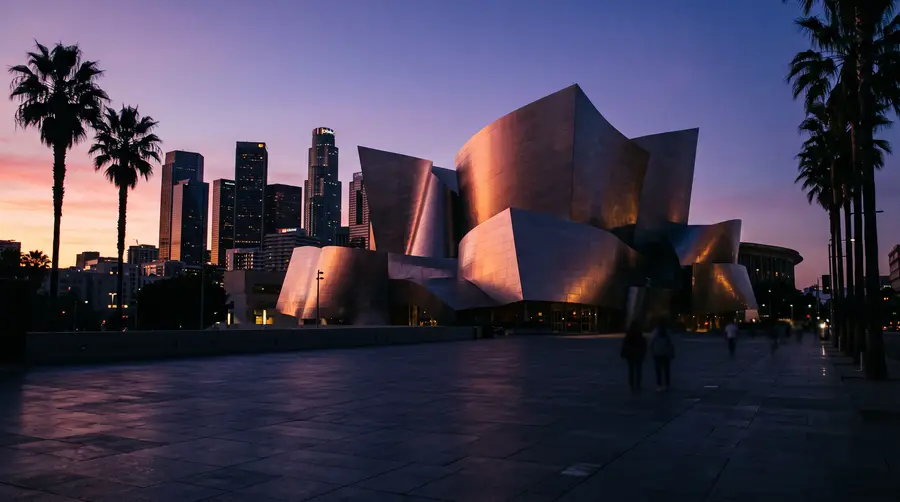
Los Angeles
A Gehry concert hall, a hilltop museum that costs nothing and an amphitheatre under the stars
 79
79Denmark
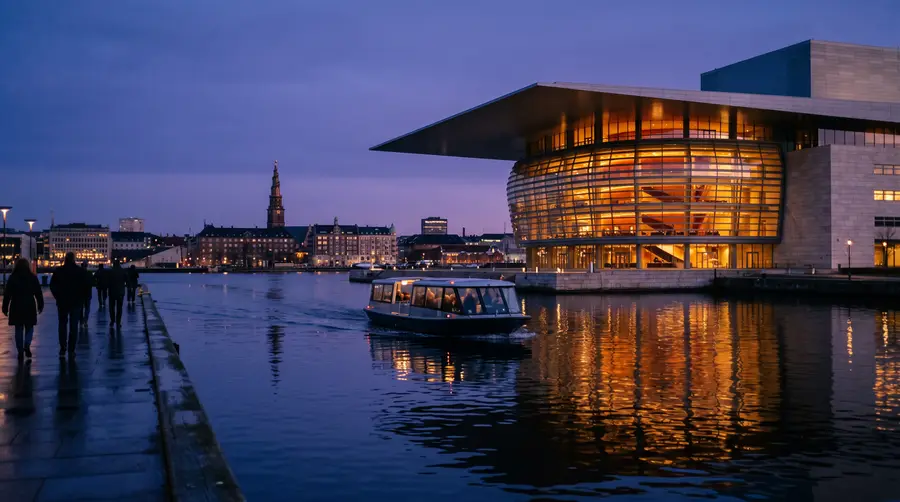
Copenhagen
An opera house given to the city, a museum in a garden by the sea and design as a civic habit
 78
78Italy
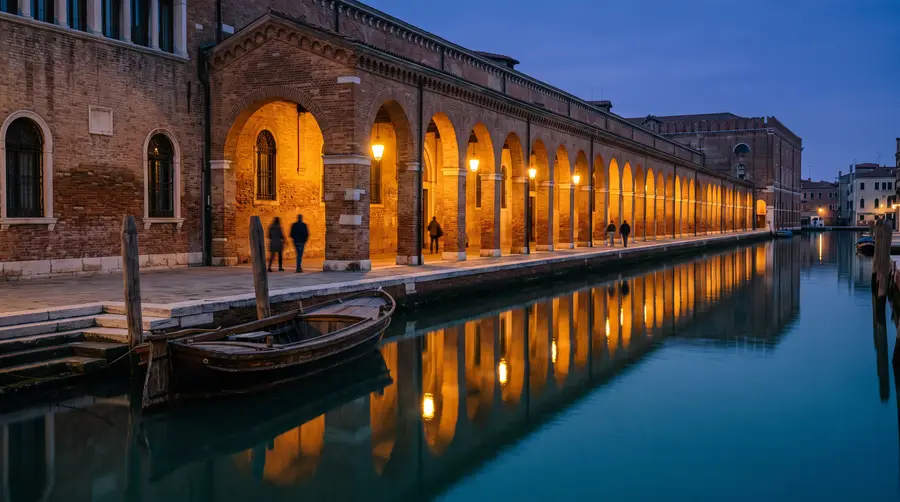
Venice
A biennale city where the exhibition is the street plan
How we score
The culture index explained
Eight measures, weighted: museums, stage and music count double, the rest once.
- Museums
- Depth and breadth of the permanent collections, not the number of buildings.
- Stage
- Opera, ballet and theatre: how much is programmed and at what level.
- Music
- Classical halls and live rooms together, from the philharmonic to the basement.
- Now
- Galleries, kunsthalles and project spaces showing work made now.
- Festivals
- How much of the year the city gives over to a programme of its own.
- Night
- What is still happening after midnight, and whether it is any good.
- Value
- What an evening costs against what you get for it.
- Access
- Opening hours, ticket availability and how easy the city is without local knowledge.